D, E, and Sporadic E with Arecibo
The normal day-time D-region electron density is extremely difficult to measure with incoherent scatter radar. This is because the radar cross-section is very low, about -125 dBsm. Keep in mind, that the radar cross-section of a 1 square meter plate is 0 dBsm. The radar cross-section of the D-region is thus about 1 trillion times smaller than that of a stop sign you'd encounter on the side of a road.
A few weeks ago, we ran some experiments with the specific intention of getting a very good D- and E-region incoherent scatter radar measurement. We were specifically interested in the E-region autocorrelation function shape at the 100 km altitude, where different collisional models provide very different results. The idea was to compare the Bhatnagar–Gross–Krook, Brownian motion, and hard sphere collision models, and to see which one fits best.
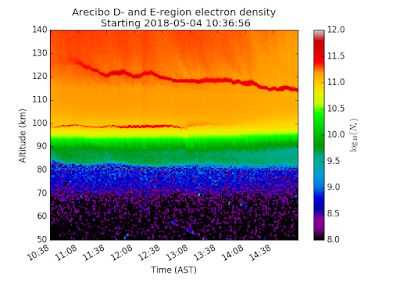
As a by-product of this measurement, we have a relatively sensitive and high resolution mode for investigating the D- and E-region of the ionosphere. Here's what the electron density looks like with this mode:
In this plot, you can also see two narrow layers at about 100 km and 120 km. These are known as sporadic E. This name is perhaps a bit of a misnomer, as this phenomena is observed quite regularly. The region of enhanced electron density within sporadic E can be merely a few hundred meters wide, which seems to defy physics. One mechanism that keeps the plasma in a narrow layer is horizontal neutral wind sheer, which through ion-neutral collisions, forces ions into a narrow layer.
Sporadic E can reflect radio waves of a higher frequency than the normal background E-region. They are often used by radio amateurs and DXers to make serendipitous long distance radio links.
A few weeks ago, we ran some experiments with the specific intention of getting a very good D- and E-region incoherent scatter radar measurement. We were specifically interested in the E-region autocorrelation function shape at the 100 km altitude, where different collisional models provide very different results. The idea was to compare the Bhatnagar–Gross–Krook, Brownian motion, and hard sphere collision models, and to see which one fits best.
As a by-product of this measurement, we have a relatively sensitive and high resolution mode for investigating the D- and E-region of the ionosphere. Here's what the electron density looks like with this mode:
 |
| The D-region is approximately 70 km to 90 km. The E-region is 90 to 150 km. |
Sporadic E can reflect radio waves of a higher frequency than the normal background E-region. They are often used by radio amateurs and DXers to make serendipitous long distance radio links.


Comments
Post a Comment